
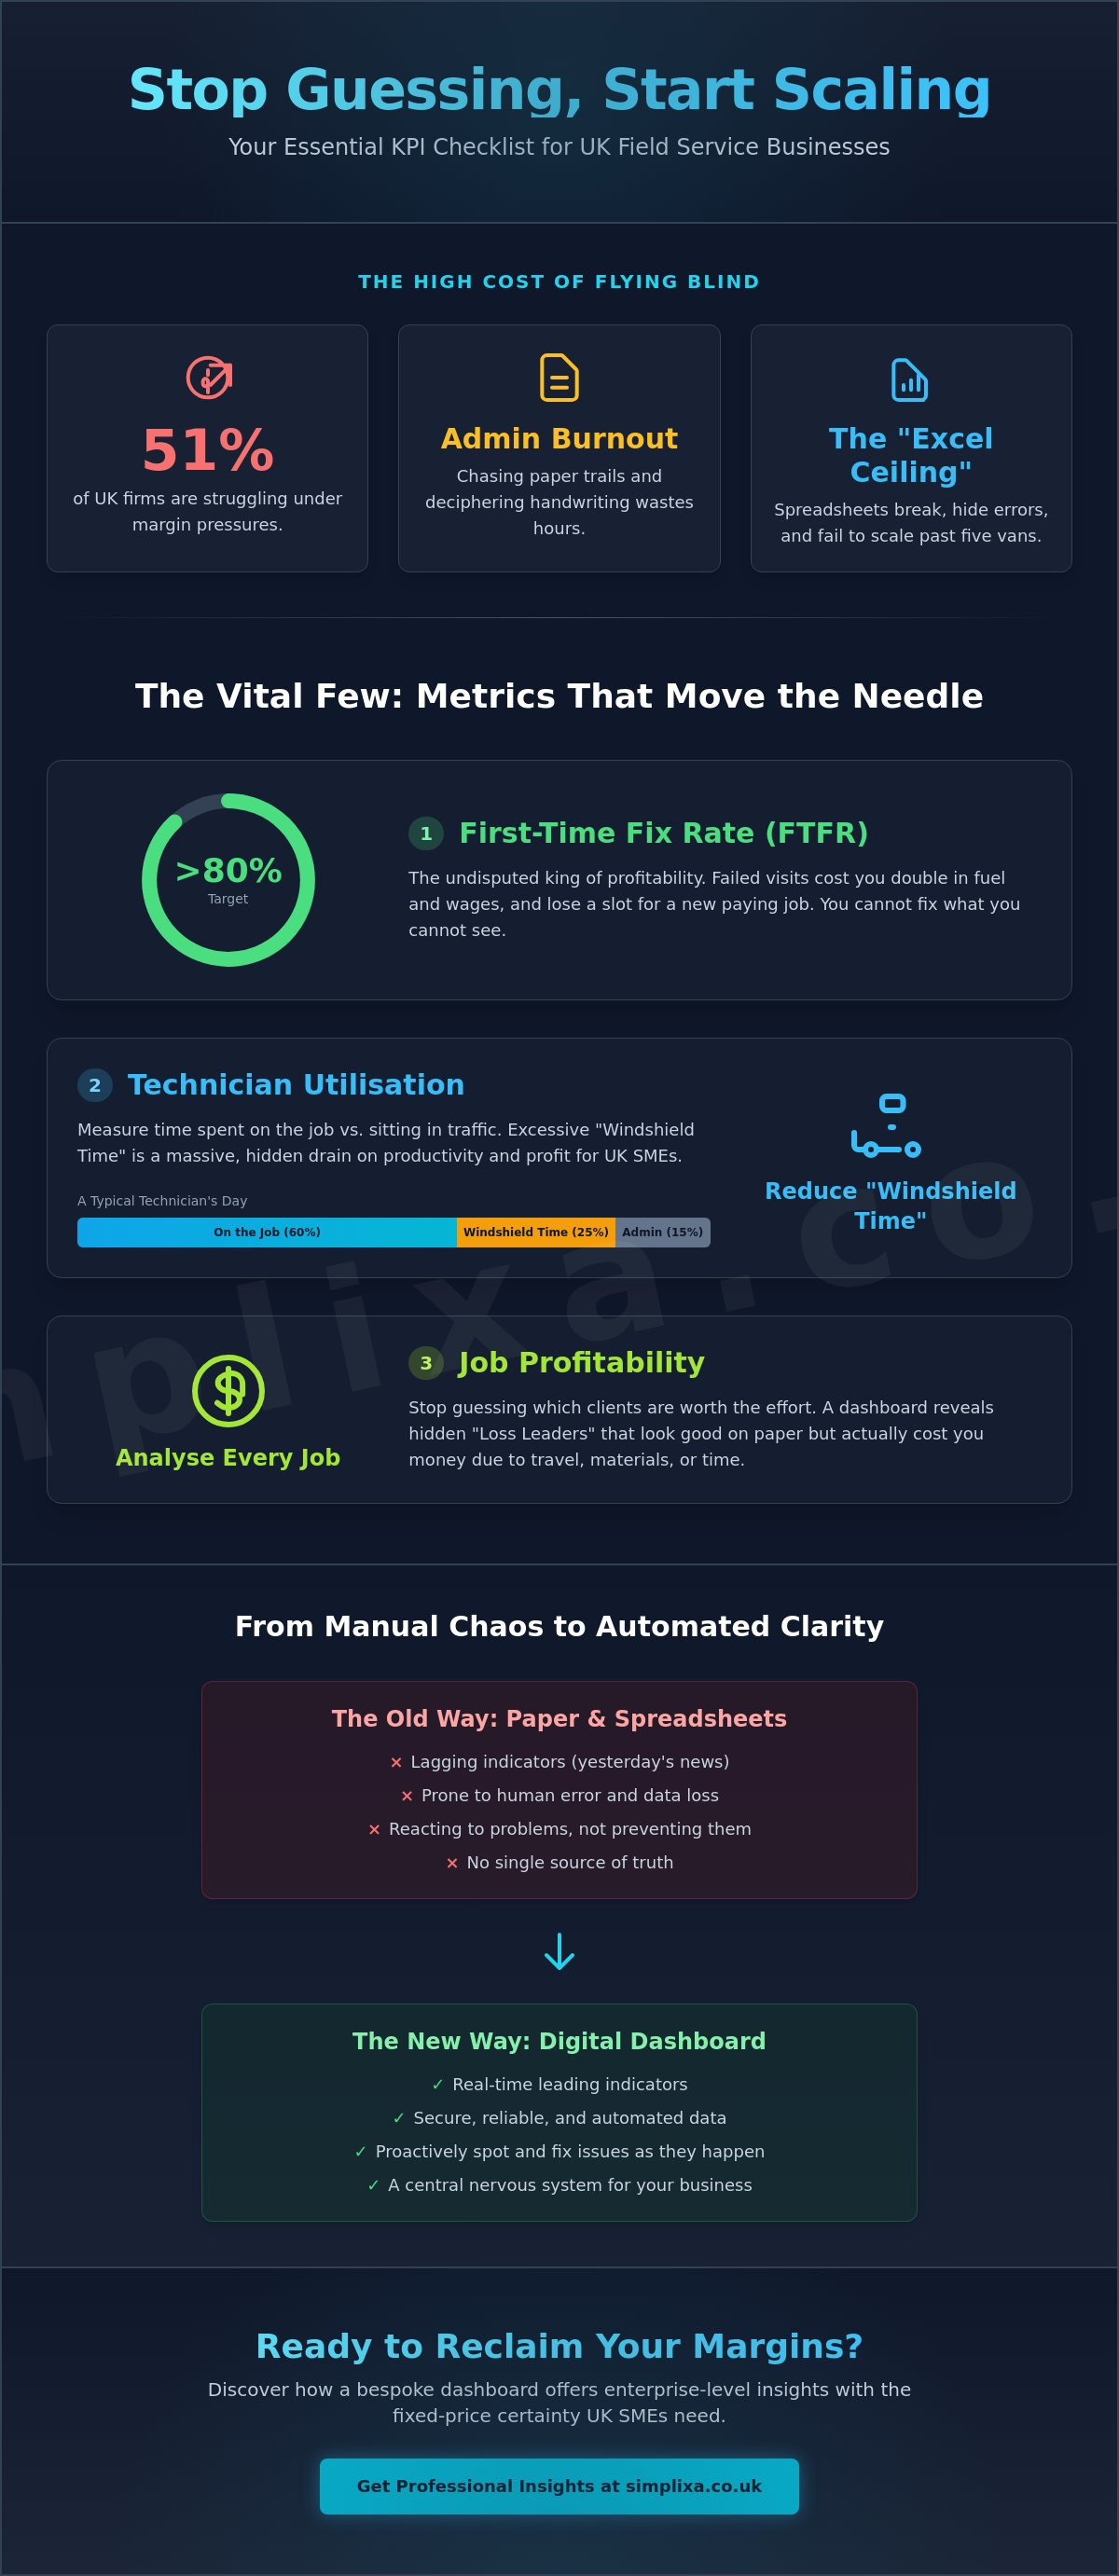
Did you know that 51% of UK field service organisations are currently struggling under the weight of margin pressures? It's a proper headache. You're likely sick of the admin burnout that comes from chasing paper trails whilst your technicians waste precious hours between jobs. Without a clear field service kpi dashboard uk, you're essentially flying blind. Most independent operators are stuck with messy spreadsheets that simply don't tell the full story of their daily operations.
It's time to stop guessing and start scaling. Moving to a professional setup doesn't have to be a technical nightmare or a massive drain on your wallet. No corporate fluff here. We're going to show you the exact metrics you need to track to reclaim your time and protect your margins. This guide provides a straightforward checklist to move your business from manual chaos to a streamlined, automated system that shows you exactly where the profit is leaking. Sorted.
Key Takeaways
- Stop relying on gut feelings and learn how to turn your operational data into a central nervous system that protects your profits.
- Identify the "Vital Few" metrics for your field service kpi dashboard uk, focusing on the First-Time Fix Rate to ensure every job counts.
- Move from lagging indicators that only show past mistakes to real-time leading indicators that let you spot and fix issues as they happen.
- Follow a practical checklist to audit your current data mess and finally ditch the spreadsheets for a professional, digital workflow.
- Discover how bespoke, custom-built tools offer the same power as enterprise software but with the fixed-price certainty that UK SMEs need.
Why Guesswork is Killing Your Field Service Profits
Running a field service business on gut feeling is like driving a van with a foggy windscreen. You might get where you're going eventually, but you're bound to hit a few curbs along the way. Most UK SME owners fall into the "Guesswork Trap". They think they know which jobs are profitable. They think they know who their best technicians are. But without a clear Key Performance Indicator (KPI) to guide them, it's all just an educated guess. When you rely on memory or "the way we've always done it", you're leaving your margins to chance.
A field service kpi dashboard uk acts as the central nervous system for your entire operation. It connects the office to the field in real-time. When data is entered manually at the end of the week, it's already dead. It's a "lagging indicator" that tells you what went wrong last Tuesday, but it does nothing to help you today. Moving from the constant stress of a bloated spreadsheet to the relief of an organised dashboard changes the game. You stop reacting to fires and start preventing them. It's the difference between being a busy fool and a profitable professional.
The Hidden Cost of "Paper and Pen" Management
Paper job sheets are silent profit killers. They get lost under van seats; they get stained with coffee; they get forgotten in pockets. Most importantly, they lead to thousands in unbilled revenue. If a technician uses an extra valve or a length of copper pipe but forgets to scribble it down, that's money straight out of your pocket. Then there's the admin staff. They spend half their day chasing technicians for updates or trying to decipher messy handwriting. By using software that makes my employees lives easier, you strip away that friction. Information flows instantly. No chasing. No shouting across the office. Just total clarity.
Why Spreadsheets Fail Once You Have More Than Five Vans
Excel is a brilliant tool for a start-up, but once you hit five vans, you hit the "Excel Ceiling". Formulas start to break. You end up with multiple versions of the same file floating around. When three different people edit one spreadsheet, errors are inevitable. A single typo in a cell can hide thousands in costs or lead to inaccurate quoting. A dedicated field service kpi dashboard uk moves your data into a secure database. It creates a single source of truth. It's about security, reliability, and finally having numbers you can actually trust to grow the business.
The UK Field Service KPI Checklist: 5 Metrics That Matter
Don't fall into the trap of tracking everything. It's a waste of time. You need to focus on the "Vital Few" metrics that actually move the needle on your bank balance. Vanity metrics, like total jobs booked, might make you feel popular, but they don't tell you if you're actually making a penny. A proper field service kpi dashboard uk should cut through the noise and show you exactly where your business stands. If a number doesn't help you make a decision, it shouldn't be on your screen. It's about clarity, not clutter.
The undisputed king of profitability is the First-Time Fix Rate (FTFR). If your technician has to go back to a site because they didn't have the right part or enough information, that job has likely just cost you money. You're paying for double the fuel, double the wages, and losing a slot where a new, paying job could have been. High-performing firms aim for an FTFR of over 80%. If yours is lower, your dashboard will highlight the leak immediately. You can't fix what you can't see.
Technician Utilisation and "Windshield Time"
There is a massive difference between a technician being "on the clock" and "on the job". Utilisation measures the percentage of the day spent actually fixing things versus sitting in traffic. We call the travel time "Windshield Time", and it's a massive drain on UK SMEs. According to the OECD UK Service Sector Report, boosting productivity in services is essential for economic resilience. For your business, it's about staying competitive. Your dashboard reveals if poor routing is sending your vans zig-zagging across the county. This visibility is key when learning how to scale business operations without more staff; you simply get more out of the team you already have.
Job Profitability: Stop Guessing Your Margins
Do you know which of your clients are actually worth the effort? Some jobs look great on paper but are "Loss Leaders" in reality. They take too long, require too many materials, or are located too far away. By using a field service kpi dashboard uk to track project profitability, you can see the true margin on every single job. You might find that your biggest client is actually your least profitable because of the admin burden they create. Once you see the hard data, you can adjust your quoting or focus your marketing on higher-margin work. If you're tired of the guesswork, a Custom CRM Software solution can pull all these numbers into one clear view. Sorted.
Building Your Dashboard: Real-Time View vs. Weekly Reports
Most business owners spend their lives looking in the rear-view mirror. Weekly or monthly reports tell you what happened last month, but they don't do a thing to help you today. These are "lagging indicators". They're essentially a post-mortem of your profits. To grow, you need "leading indicators". You need to know what's happening right now. A field service kpi dashboard uk gives you that live road map. It shifts your focus from what went wrong to what you can still get right before the sun goes down.
Data shouldn't be a chore to read. If you're staring at rows of numbers in a grid, your brain will eventually just switch off. A professional dashboard uses visual signals. Think of a "Traffic Light" system. Green means a job is on track. Amber means a technician is running late. Red means a job has stalled or a margin is slipping. You can spot a problem in two seconds without reading a single line of text. It's about getting the information you need at a glance so you can get back to work.
Geolocation data is the secret weapon here. It isn't about "spying" on your team; it's about validating status without the nagging phone calls. Nobody likes being asked "Where are you?" every twenty minutes. With a live dashboard, you can see exactly where the vans are. You know if a technician is on-site, in transit, or stuck at a merchant. It provides the proof you need to keep things moving whilst keeping the atmosphere in the team positive and professional.
Why "Real-Time" is the Game Changer for Dispatch
When an emergency job comes in, you shouldn't have to guess who is closest. Real-time data lets you re-route the nearest technician instantly. This drastically reduces travel time and keeps your customers happy with accurate ETAs. It also makes your quoting process much sharper. When you know exactly who is available and where they are, you can commit to jobs with confidence rather than "maybe" or "hopefully".
Historical Trends: Spotting the Profit Leaks
Whilst real-time data handles today, your field service kpi dashboard uk also builds a valuable history. After 3-6 months, patterns start to emerge. You might notice that a specific type of boiler always leads to a second visit, suggesting a training gap. You can predict seasonal demand and manage your staff levels before the winter rush hits. Plus, if you ever decide to sell the business, having "Clean Data" history makes your company far more attractive to buyers. It proves your business is a well-oiled machine, not just a collection of vans and tools.
Implementation Checklist: Transitioning to a Digital Dashboard
Moving from a stack of paper job sheets to a professional field service kpi dashboard uk doesn't happen by accident. It requires a bit of a plan. If you try to change everything on a Monday morning, you'll likely face a revolt in the yard. The goal is to move from manual chaos to digital relief without breaking the business in the process. It's about taking logical steps that provide immediate value to both the office and the field. You don't need to be a tech genius; you just need to be organised.
- Step 1: Audit your "Data Mess". Look at where your numbers currently live. They're likely scattered amongst WhatsApp messages, sticky notes, and the back of old invoices. You can't build a dashboard on a foundation of scraps.
- Step 2: Choose your "North Star" metric. Don't try to track fifty things at once. Pick the one number that defines success for your business right now. Is it your first-time fix rate or your average job margin?
- Step 3: Standardise field data collection. If Dave calls a part a "valve" and John calls it a "fitting", your data will be useless. Everyone needs to record information in the exact same way.
- Step 4: Pilot with a "Power User". Don't flip the switch for the whole fleet at once. Pick your most tech-savvy technician and let them test the system for a week to iron out the kinks.
- Step 5: Review and Refine. Dashboards are not "set and forget" tools. Review your numbers every Friday and adjust your views as your business grows.
Mapping Your Existing Data Sources
To get a clear view, you need to pull data from everywhere. This includes your GPS trackers, your digital forms, and your accounting software like Xero or QuickBooks. Identifying the "Gaps" is just as important as finding the data you already have. You might realise you aren't actually capturing how long a technician spends at the merchant's. By creating a single source of truth, you avoid the headache of conflicting reports. When the numbers in the office match the reality in the field, you finally have data you can trust.
User Adoption: Getting the Team to Actually Use the App
Technicians are often wary of new tech. They see it as "Big Brother" watching their every move. You need to flip that script. Show them how the app kills the admin they hate. If the mobile interface is easier than using a pen, they'll use it. You can even use the dashboard stats for a bit of friendly competition. Rewarding the technician with the highest fix rate or the best customer feedback turns a chore into a game. Ready to stop the paper chase? Start building your Custom CRM Software today and get the visibility you deserve.
Bespoke Dashboards: Professional Insights Without the Enterprise Price Tag
You don't need a private jet when a reliable van will do the job. Many software firms try to push UK SMEs towards massive enterprise platforms that are frankly overkill. These systems come with eye-watering price tags and a level of complexity that requires a full-time IT department just to keep the lights on. It's a massive barrier to entry for a 10-van operation. You need a field service kpi dashboard uk that speaks your language; not one that requires a degree in data science to understand.
At Simplixa, we take a different path. We build custom tools specifically for your unique workflow. If you have a specific way of quoting or a unique method for tracking inventory, the dashboard should adapt to you. Not the other way around. Our "No-Bloat" promise means you get exactly the features you need to grow, and none of the expensive fluff you'll never touch. It's about speed to value. We aim to get a functional system into your hands in weeks, not months. No long-winded consultations. Just practical solutions that work from day one.
The Simplixa Way: Fixed Price, No Hidden Hourly Rates
Budgeting for a tech project can be a nightmare. Most agencies love to talk about "hourly rates" and "discovery phases" that never seem to end. It's a recipe for anxiety. We prefer fixed-price certainty. You know exactly what the cost is upfront. No hidden fees. No "billable hour" surprises. We strip away the technical jargon and focus entirely on business utility. Our focus is on the independent operator who wants to professionalise without being overcharged. We're champions for the small-scale operator because we know that's where the real work happens.
Reclaiming Your Evenings: Automation That Works for You
The ultimate goal of a field service kpi dashboard uk isn't just to look at pretty charts. It's to give you your life back. When your data is automated, you stop being the "human bridge" between the office and the field. You move from a state of constant firefighting to a state of forward planning. Imagine finishing your Friday without a pile of unread job sheets on your desk. Imagine knowing your profit margins are protected whilst you're actually at home with your family. That's the real promise of organisation. It's time to stop the admin grind and focus on growth. Get a fixed-price quote for your custom dashboard and let's get it sorted.
Take Control of Your Field Service Growth Today
You've seen how manual data entry and guesswork can quietly bleed your business dry. It's an exhausting way to work. Moving to a digital system isn't about chasing fancy tech; it's about protecting your margins and finally giving your office staff some breathing room. By focusing on the vital few metrics like your first-time fix rate, you turn your operation from a daily scramble into a predictable, well-oiled machine.
Investing in a field service kpi dashboard uk is the fastest way to stop being a busy fool and start being a profitable pro. At Simplixa, we build custom tools designed specifically for UK SMEs rather than overblown enterprise firms. With fixed-price project costs and local UK-based development, you get total clarity without the threat of hidden hourly rates. We focus on utility over aesthetics to ensure your system actually works for your team.
Stop guessing and start growing with a custom dashboard
It's time to reclaim your evenings and focus on the big picture. You've done the hard work of building the business; now let the right systems help you scale it. Sorted.
Frequently Asked Questions
What is a field service KPI dashboard?
It is a visual control centre that tracks your business performance in real-time. Instead of digging through old job sheets or text messages, all your data flows into one screen showing clear charts and status lights. It acts as the central nervous system of your operation, connecting the office to the field so you can see exactly where your profit is coming from.
Can I build a field service dashboard in Excel?
You can start there, but it usually hits a ceiling once you have more than five vans. Excel relies on manual data entry, which is slow and prone to human error. A professional field service kpi dashboard uk automates the process, pulling numbers directly from the field so you aren't stuck typing in data at ten o'clock at night.
How much does it cost to implement a KPI dashboard in the UK?
Costs vary depending on whether you choose a monthly subscription model or a bespoke, fixed-price build. Whilst some enterprise platforms charge per user, every month, many SME owners prefer the certainty of knowing the total cost upfront. You should always check if the price includes UK-based support and customisation to avoid hidden fees as you grow.
What are the most important KPIs for a small field service business?
Focus on the "Vital Few" rather than tracking everything. Your First-Time Fix Rate is the most important for profitability, followed by Technician Utilisation and Job Profitability. These numbers tell you if your team is being efficient and if your clients are actually worth the effort, helping you avoid the trap of being a "busy fool".
How do I get my technicians to use a tracking app?
Show them how it kills the admin burden they hate. If the app handles their job sheets and parts recording automatically, they spend less time on paperwork and more time on the tools. It isn't about "Big Brother" watching them; it's about making their lives easier so they can finish their day without a pile of forms to fill in.
Do I need a custom dashboard or off-the-shelf software?
Off-the-shelf software is a quick fix but often forces you to change your workflow to fit their rigid system. A custom field service kpi dashboard uk is built specifically for your unique business processes. If you have a specific way of quoting or tracking inventory, a bespoke tool ensures the software works for you, not the other way around.
How long does it take to set up a field service dashboard?
A functional dashboard can usually be up and running in a matter of weeks. The setup time depends on how many data sources you need to link, such as GPS trackers or accounting software. Starting with a pilot for one or two technicians helps iron out any kinks before you roll it out to the whole fleet.
Will a dashboard help me with my VAT and accounting?
Yes, because it creates a single source of truth for all your job costs. When materials and labour are recorded digitally in the field, your end-of-month accounting becomes far more accurate. It stops the last-minute scramble for lost receipts and ensures your VAT returns are based on hard data rather than rough guesses.
